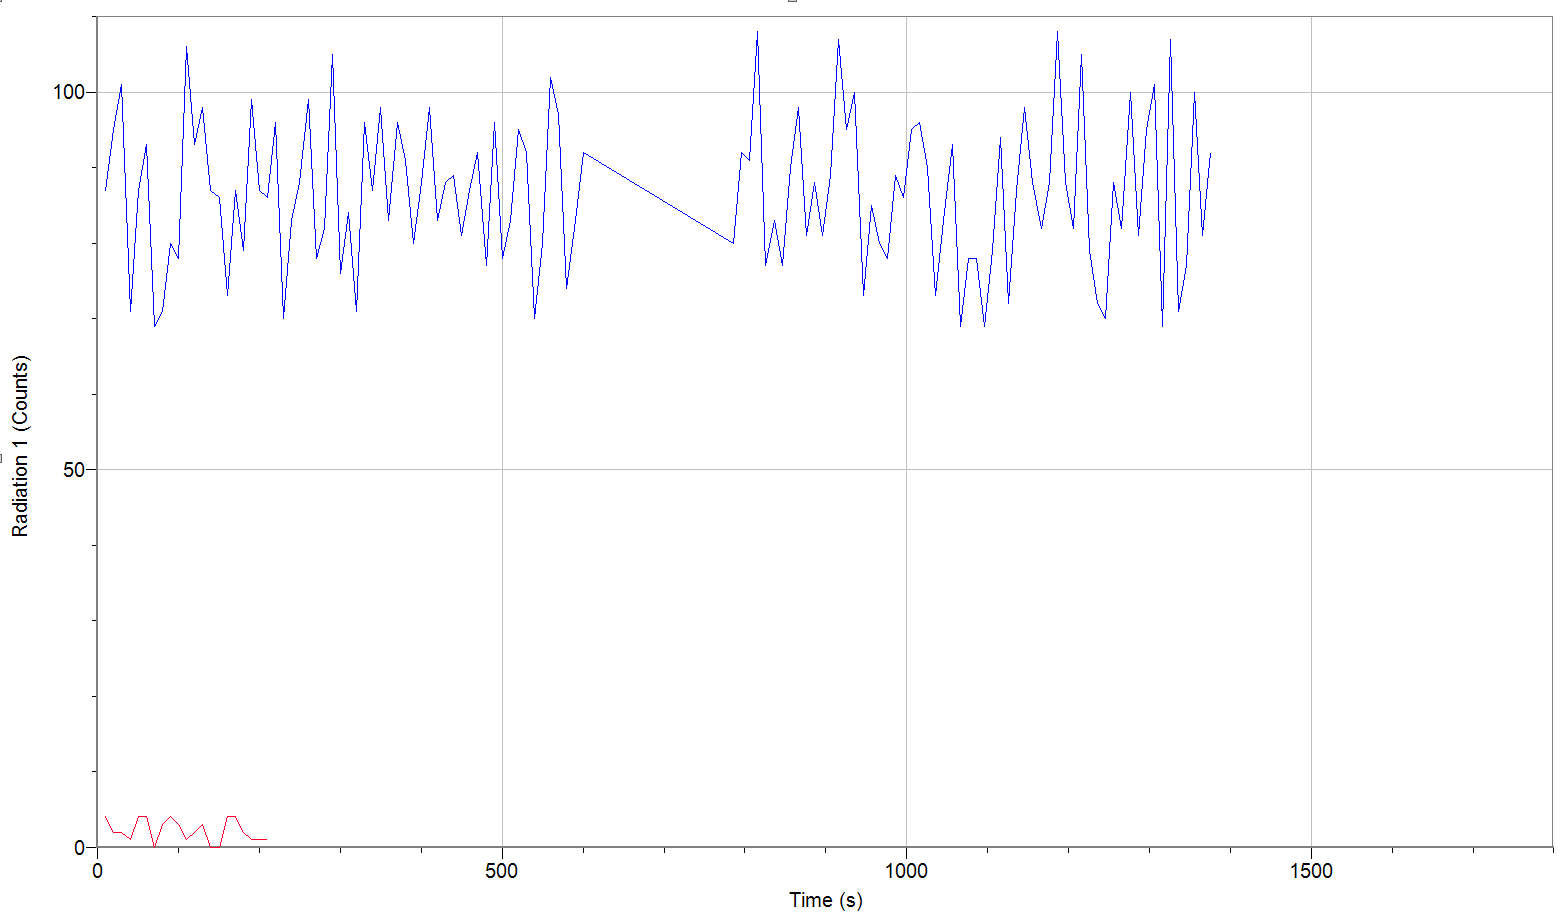
Data
Data Analysis
Full width at half-maximum: 10 (though this estimate is somewhat misleading noting how irregular the resulting bell curve is)
Questions
1. In order to evaluate what the decay rate of the reaction was in absence of any background radiation, one would have to measure the background radiation independently of the sample in order to remove that component of the radiation when testing the radioactive sample.
2. There are numerous sources to the background radiation, including (but not limited to) bananas in people's backpacks (from the radioactive potassium isotopes) and the earth's natural radiation (from the decay of underground radioactive isotopes)
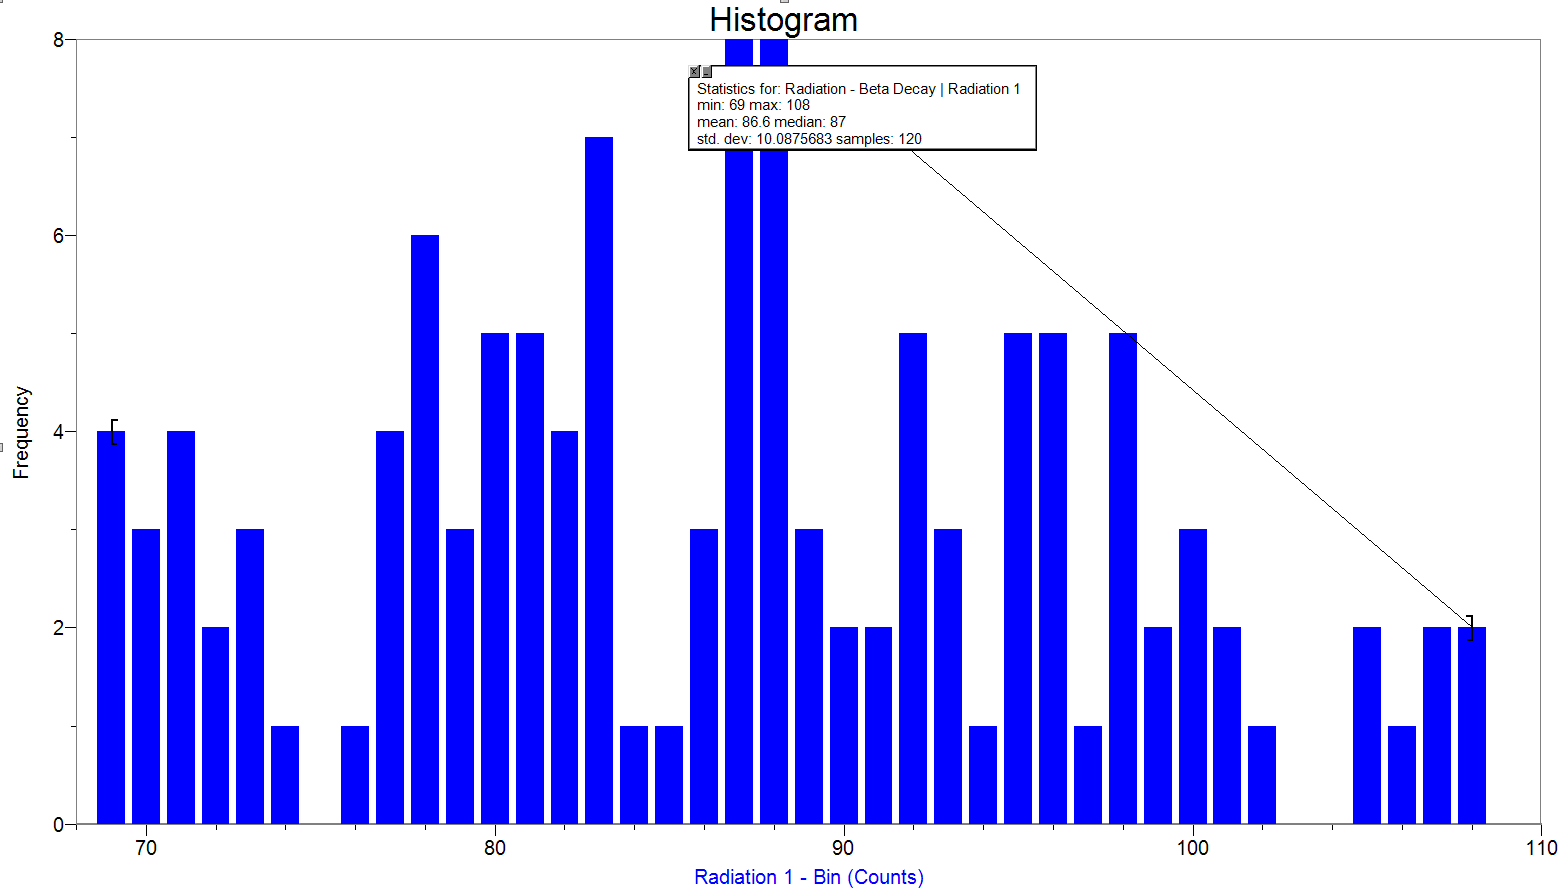
3. The peak count (mode) does not exist as no one count of radiation is higher than any other, but there is a peak in the bell curve in the neighborhood of 87-88. The mean is 86.6. The median is 87. The standard deviation of the data sample is 10.088.
4. The median and the mean differ by fewer than 1 radiation count (0.4 counts), meaning that the graph is not right- or left- shifted, resulting in a centered distribution.
5. It is in the shape of a Gaussian bell curve. Auto-fitting a Gaussian bell curve to the data set (and adjusting the bin size) results in the following distribution:
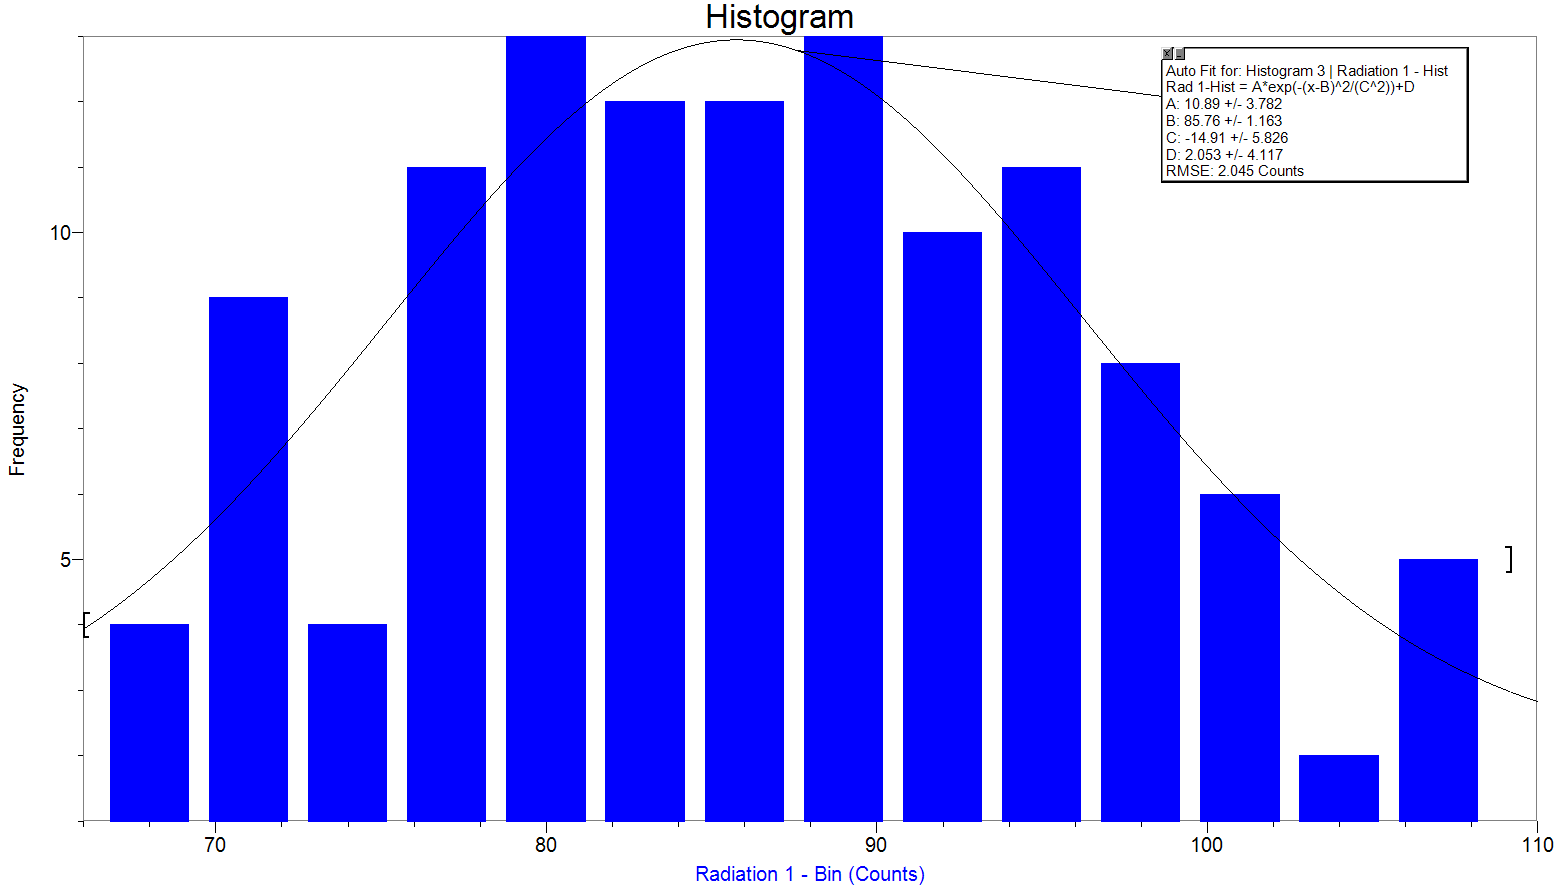
6. It's a Gaussian bell curve because it looks like a bell and it's a curve.
7. Because the radioactive decay is a purely probabilistic phenomenon, meaning that though it's likely that the radiation counts will be at the peak, it is not certain, as each nucleus decays independently at a random interval.
8. Yes the decays are random because if they weren't, all the counts would occur at the peak, and none elsewhere. Instead, the decays are normally distributed about the peak, showing a probabilistic distribution and therefore random.
9. The full width at half maximum is 10 (with the unadjusted bin size bell curve). This value indicates a general approximation (when compared with other data sets) as to the centeredness of the data (or rather how close to center the data set lies).
10. No, it is impossible to predict exactly when a nucleus will decay. With probabilities, one can predict within a range of uncertainty when a nucleus will decay within a range, but there is a probability (however small) that it will take many times as long as expected.
11. Yes, however small.
12. Yes, however small.
13. No, the sample would be emitting fewer particles since some of its radioactive isotope had transitioned into a stable form, lessening radioactivity over time.
14. More counts would be observed if the number of seconds of observation were increased, but the average number per unit time would not change as the material did not change in any way over the two experiments.
15. No, some is due to the background radiation sources, which skews the counts higher than what is actually emitted.
16.
| |
30 seconds |
1 minute |
2 minutes |
5 minutes |
10 minutes |
20 minutes |
| Average |
94.33 |
89.00 |
85.92 |
86.33 |
86.68 |
86.58 |
| Standard Deviation |
7.024 |
10.28 |
12.23 |
10.59 |
9.509 |
10.09 |
The average approaches the end average as more data is logged. The standard deviation also converges upon the end value as well.
17. Since capturing the particle is a matter of surface area, and surface area is proportional to radius squared, if the distance (read: radius) is doubled, the total surface area for the particles is quadrupled. As such, 1/4 of the amount of particles would be captured by the same surface area of the detector.


 icons at the top right corner of the subsection.