Projectile Lab
I. Procedure:
1. Use a video camera to record the path of the projectile from the moment it leaves the cannon to the moment it hits the floor. Place a meter stick along the path of the projectile for use in scaling. Take 3-5 videos to ensure that at least one is of good quality.
2. Using the best video, plot the horizontal displacement as a function of time. Use a line of best fit to find the velocity (which will be the line's slope).
3. Using the best video, plot the vertical displacement as a function of time. Use a best fit curve to find the initial vertical velocity (which will be the coefficient of the linear term).
4. Use the initial vertical and horizontal velocities to find the overall initial velocity.
5. Using a meter stick, measure the distance from the floor to the mouth of the cannon.
6. Use a video camera to record the path of the buggy as it travels. Again, take 3-5 videos to ensure good quality.
7. Using the best video, plot the buggy’s displacement as a function of time. Use a line of best fit to find the velocity (which will be the line's slope).
II. Data
y0= 1.15 m +/- .01 m
a. Projectile:
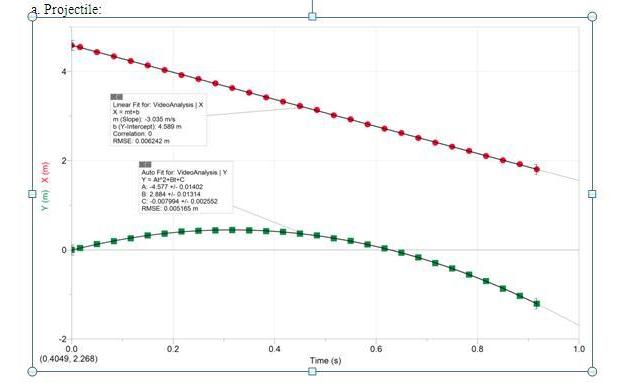
x = -3.035t
v0x= 3.035 m/s
y = -4.577t2 + 2.884t
v0y = 2.884 m/s (+/- .01314 m/s, according to Logger Pro)
b. Buggy:

x = .419t
vbuggy = .419 m/s
III. Calculations
v02 = vx02 + vy02 = (3.035 m/s)2 + (2.884 m/s)2 = 17.5 m2/s2
v0 = 4.19 m/s
IV. Description of alternate method
Using kinematics equations, we derived this relationship between angle and range:

Then, using a graphing calculator we graphed this equation and found the angle (33.5º) that corresponded best to the given range of 3 meters.
The time the projectile needed to cover that range was
x/(v0 cosθ) = (3 m)/((4.19 m/s)(cos 33.5º) = .86 s
The time the buggy needed to cover that range was
x/vbuggy = (3 m) / (.419 m/s) = 7.16 s
So the time the buggy needed to travel before firing the projectile was
7.16 s - .86 s = 6.30 s
V. Reflection
Using our model, we did not produce a very accurate result—we probably overshot the buggy by about 10 cm. I think the biggest problem was the video; analyzing the video just involved too much uncertainty. For instance, for any given video, the scale might be a little off (i.e. a meter in the video might not correspond exactly to a meter in the given video), the position of the ball we marked on the video might not be very accurate in certain frames (especially when the ball passed the cabinets—yellow on light brown is very hard to see), and so on. Also, in the end we were only analyzing one video; even though we looked through all the videos and chose the best, there was no guarantee that that video was very accurate.
If we had a chance to do the lab again, I think we would opt for an approach that doesn’t involve video. For instance, we could launch several projectiles, mark the position where they hit with carbon paper, and measure the horizontal distance and time. This way, we would probably have time to do many trials, so even if a few data points were not very good, the average of all of them would still give us accurate data.


 icons at the top right corner of the subsection.